The daily temperatures collected at the Brera Astronomical Observatory in Milano span from january the first 1763 to the end of 2024. It takes about 90 seconds to read the csv file with “csv.read” and more than four minutes to compute the yearly maximum temperature with “st.min.max”.
make "df (csv.read "milano_brera_1763_2024.csv [num num num num num num])

dataframe: 95694 observations, 6 variables
year (num): 1763 1763 1763 1763 1763 1763 1763 1763 1763 1763 ...
month (num): 1 1 1 1 1 1 1 1 1 1 ...
day (num): 1 2 3 4 5 6 7 8 9 10 ...
prec (num): -99.9 -99.9 -99.9 -99.9 -99.9 -99.9 -99.9 -99.9 -99.9 -99.9 ...
tempMin (num): -5 -4 -2.9 -2.4 0.1 -0.7 0.2 -2.2 0.2 0.2 ...
tempMx (num): -3.6 -2.6 -0.9 -0.4 2.1 1.3 2.4 1 2.4 2.4 ...
“tempMin” and “tempMx” are respectively the daily minimum and maximum temperatures, “prec” the daily rainfall.
make "df df.delete.variables (st.min.max :df "tempMx [year] [num]) [min]

dataframe: 262 observations, 3 variables
year (num): 2024 2023 2022 2021 2020 2019 2018 2017 2016 2015 ...
n (num): 366 365 365 365 366 365 365 365 366 365 ...
max (num): 36.5 37.7 37.1 35.9 36.4 36.9 35.3 37.9 35.4 37.3 ...
The yearly maximum temperature “max” increases over the whole period, with a moderate downturn for the better part of the twentieth century.
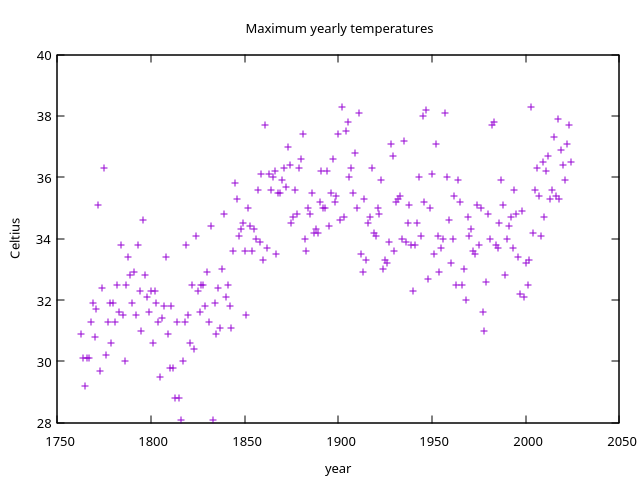
The figure has been produced with Gnuplot, a command-line plotting utility, driven by a UCBLogo function ( gp.lg ).
load "gp.lg

(gp.plot :df [year max] "points "year "|Celtius| "|Maximum yearly temperatures|)