UCBLogo in combination with Gnuplot can produce statistical thematic maps in which areas are styled to represent the variation of values for a single variable. For example:
- Read a CSV file of geographical coordinates of 20 italian regions.
- Join boundary data with regional average scores in math, upper secondary education, 2025.
- Create a thematic map with Gnuplot.
make "df (csv.read "ita.csv [num num num num])
make "table df.select.variables (csv.read "punteggi.csv [char char num num]) [id punteggio]
make "df df.table.join :df :table [id] [id]
df.struct :df

dataframe: 11078 observations, 5 variables
x (num): 223.7 224.1 223.7 223.6 223.6 224.3 224.5 224.5 224.8 225.0 ...
y (num): 143.1 144.8 144.9 145.2 145.8 150.5 153.0 154.4 156.1 156.5 ...
id (num): 1 1 1 1 1 1 1 1 1 1 ...
id1 (num): 1 1 1 1 1 1 1 1 1 1 ...
punteggio (num): 245 245 245 245 245 245 245 245 245 245 ...

load "gp.lg
(gp.map :df "|Italian regions, average math scores, 2025|)
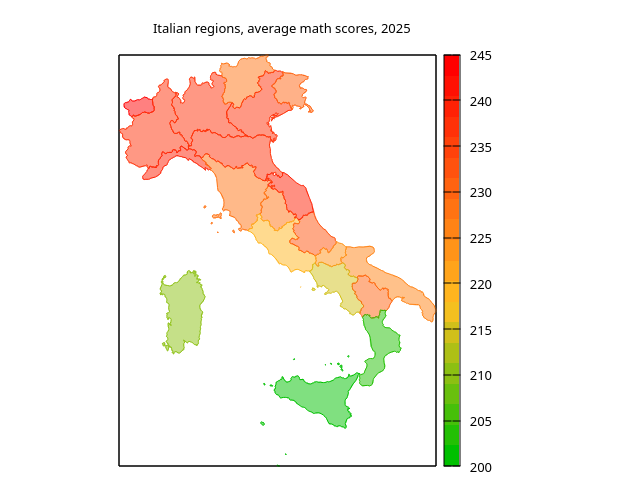
Achievement scores clearly decrease going from northern Italy to the south.
A few details
We extracted regional boundaries from a SVG file (see simplemaps ), creating the CSV file “ita.csv”. Each italian region — id from 1 to 20 – is a polygon or a multipolygon when a region includes more than one polygon (index id1). For example, region 19 “Emilia-Romagna” is a single polygon, “Sardegna” (id=18) comprises six polygons (the main island and five other smaller islands).
id id1   N
18   1  30
18   2  15
18   3 587
18   4  30
18   5  20
18   6  21
19   1 728