Csv.read and the dataframe and statistical functions can reasonably handle up to a few tens of thounsands observations but cannot cope with the whole New York City Marathon results dataset, containing individual results for the New York City Marathon from 1970 to the present (in september 2025 1.460.286 observations).
A different strategy would be progressively calculating a summary statistic while reading each line of the CSV file. The following function (nycm.lg) creates the minimum finish time for each year and gender from a reduced version – only four variables – of the general NYCM CSV file in about 10 minutes.
make "out bd.summary "nycm.csv [Year Gender] [num char] "Finish
csv.write :out "nycm_aggr.csv
Very few women partecipated to the Marathon until 1979; moreover there are a limited number of missing values in the “Gender” variable, that in 2021 acquired a new “X” category. Removing those cases the number of partecipants reduces from 1.460.286 to 1.445.161.
make "df (csv.read "nycm_aggr.csv [num char num num])
make "df df.drop.all.missing :df
make "df df.filter :df [ifelse not equalp ? "X ["true] ["false]] [Gender]
make "df df.filter :df [ifelse greaterp ? 1978 ["true] ["false]] [Year]
make "men df.rename.variables df.select.rows :df "Gender "M [MIN] [min.m]
make "women df.rename.variables df.select.rows :df "Gender "W [MIN] [min.f]
make "mf df.cbind (df.delete.variables :men [Gender N]) (df.delete.variables :women [Year Gender N])
df.struct :mf

dataframe: 44 observations, 3 variables
Year (num): 1979 1980 1981 1982 1983 1984 1985 1986 1987 1988 ...
min.m (num): 7902 7781 7693 7769 7739 8093 7894 7866 7861 7700 ...
min.f (num): 8853 8741 8729 8834 8820 8970 8914 8886 9017 8887 ...

load "gp.lg
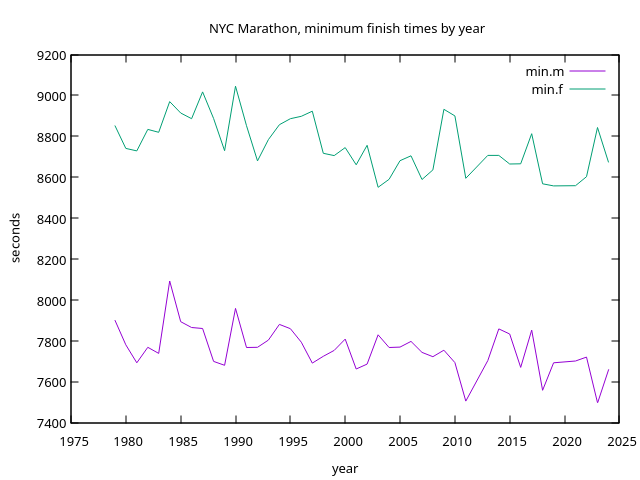
(gp.plot :mf [Year min.m min.f] "lines "year "|seconds| "|NYC Marathon, minimum finish times by year|)
As shown in the following figure, the yearly minimum finish time decreases slightly between 1979 and 2024 for both women and men.